
Reports
Statistics in the advertiser console is where you check how your money is performing. It covers a date range you choose, defaulting to the last seven days.
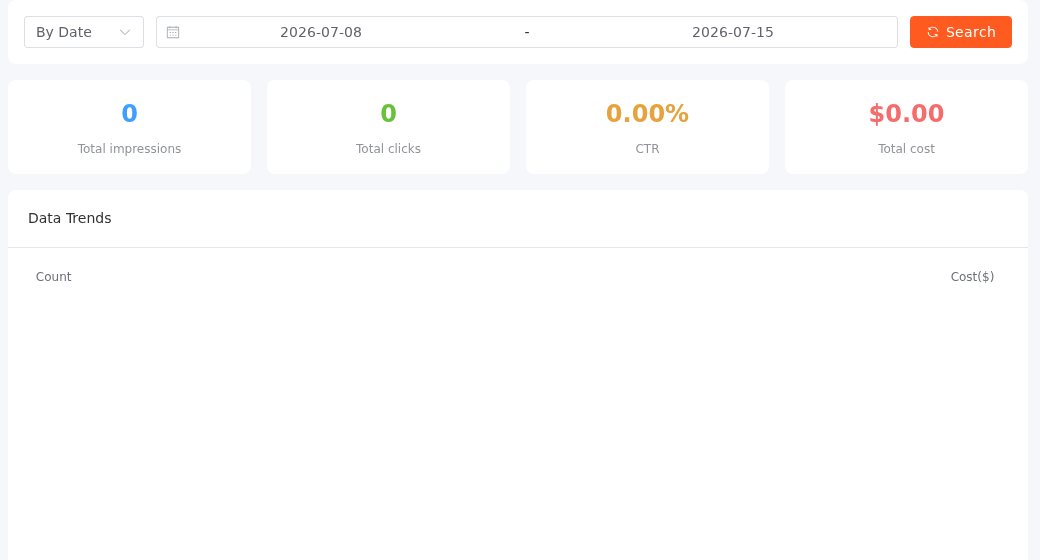
Metrics
| Metric | Meaning |
|---|---|
| Impressions | Times your ad was served |
| Clicks | Times it was clicked |
| CTR | Clicks ÷ impressions |
| Conversions | Conversions attributed by your tracker |
| Cost | What you spent |
| eCPM | Cost per thousand impressions — the number the auction actually ranks on |
eCPM is the one to watch. It is the common denominator across pricing models: it tells you what your traffic really costs per thousand impressions whether you bid CPC, CPM or CPA, and it is what decides whether you win auctions at all.
Breakdowns
- By date — the daily series, plotted and tabulated. This is the default.
- By device — PC, mobile and tablet side by side. Worth checking before you set bid adjustments: find out what mobile is actually worth to you before you bid 20% more for it.
Per-campaign numbers live on the campaign detail page, which charts impressions, clicks and cost for that campaign on its own.
Report data is not settlement data
The numbers here are a near-real-time estimate, refreshed on a few-minute cadence from the event stream. Your balance is a different figure, produced by hourly settlement from a different source, and it is the authoritative one where money is concerned.
Reported spend runs slightly ahead of settled spend, because traffic that anti-fraud later rules invalid is counted here but never billed. That gap is expected and self-correcting — it is not a bug, and you do not need to reconcile it by hand.
Settlement & Payouts explains the two figures and why they differ. When they disagree, settlement wins.